Original English text
| | |
| __FromWater lots To Water Security,
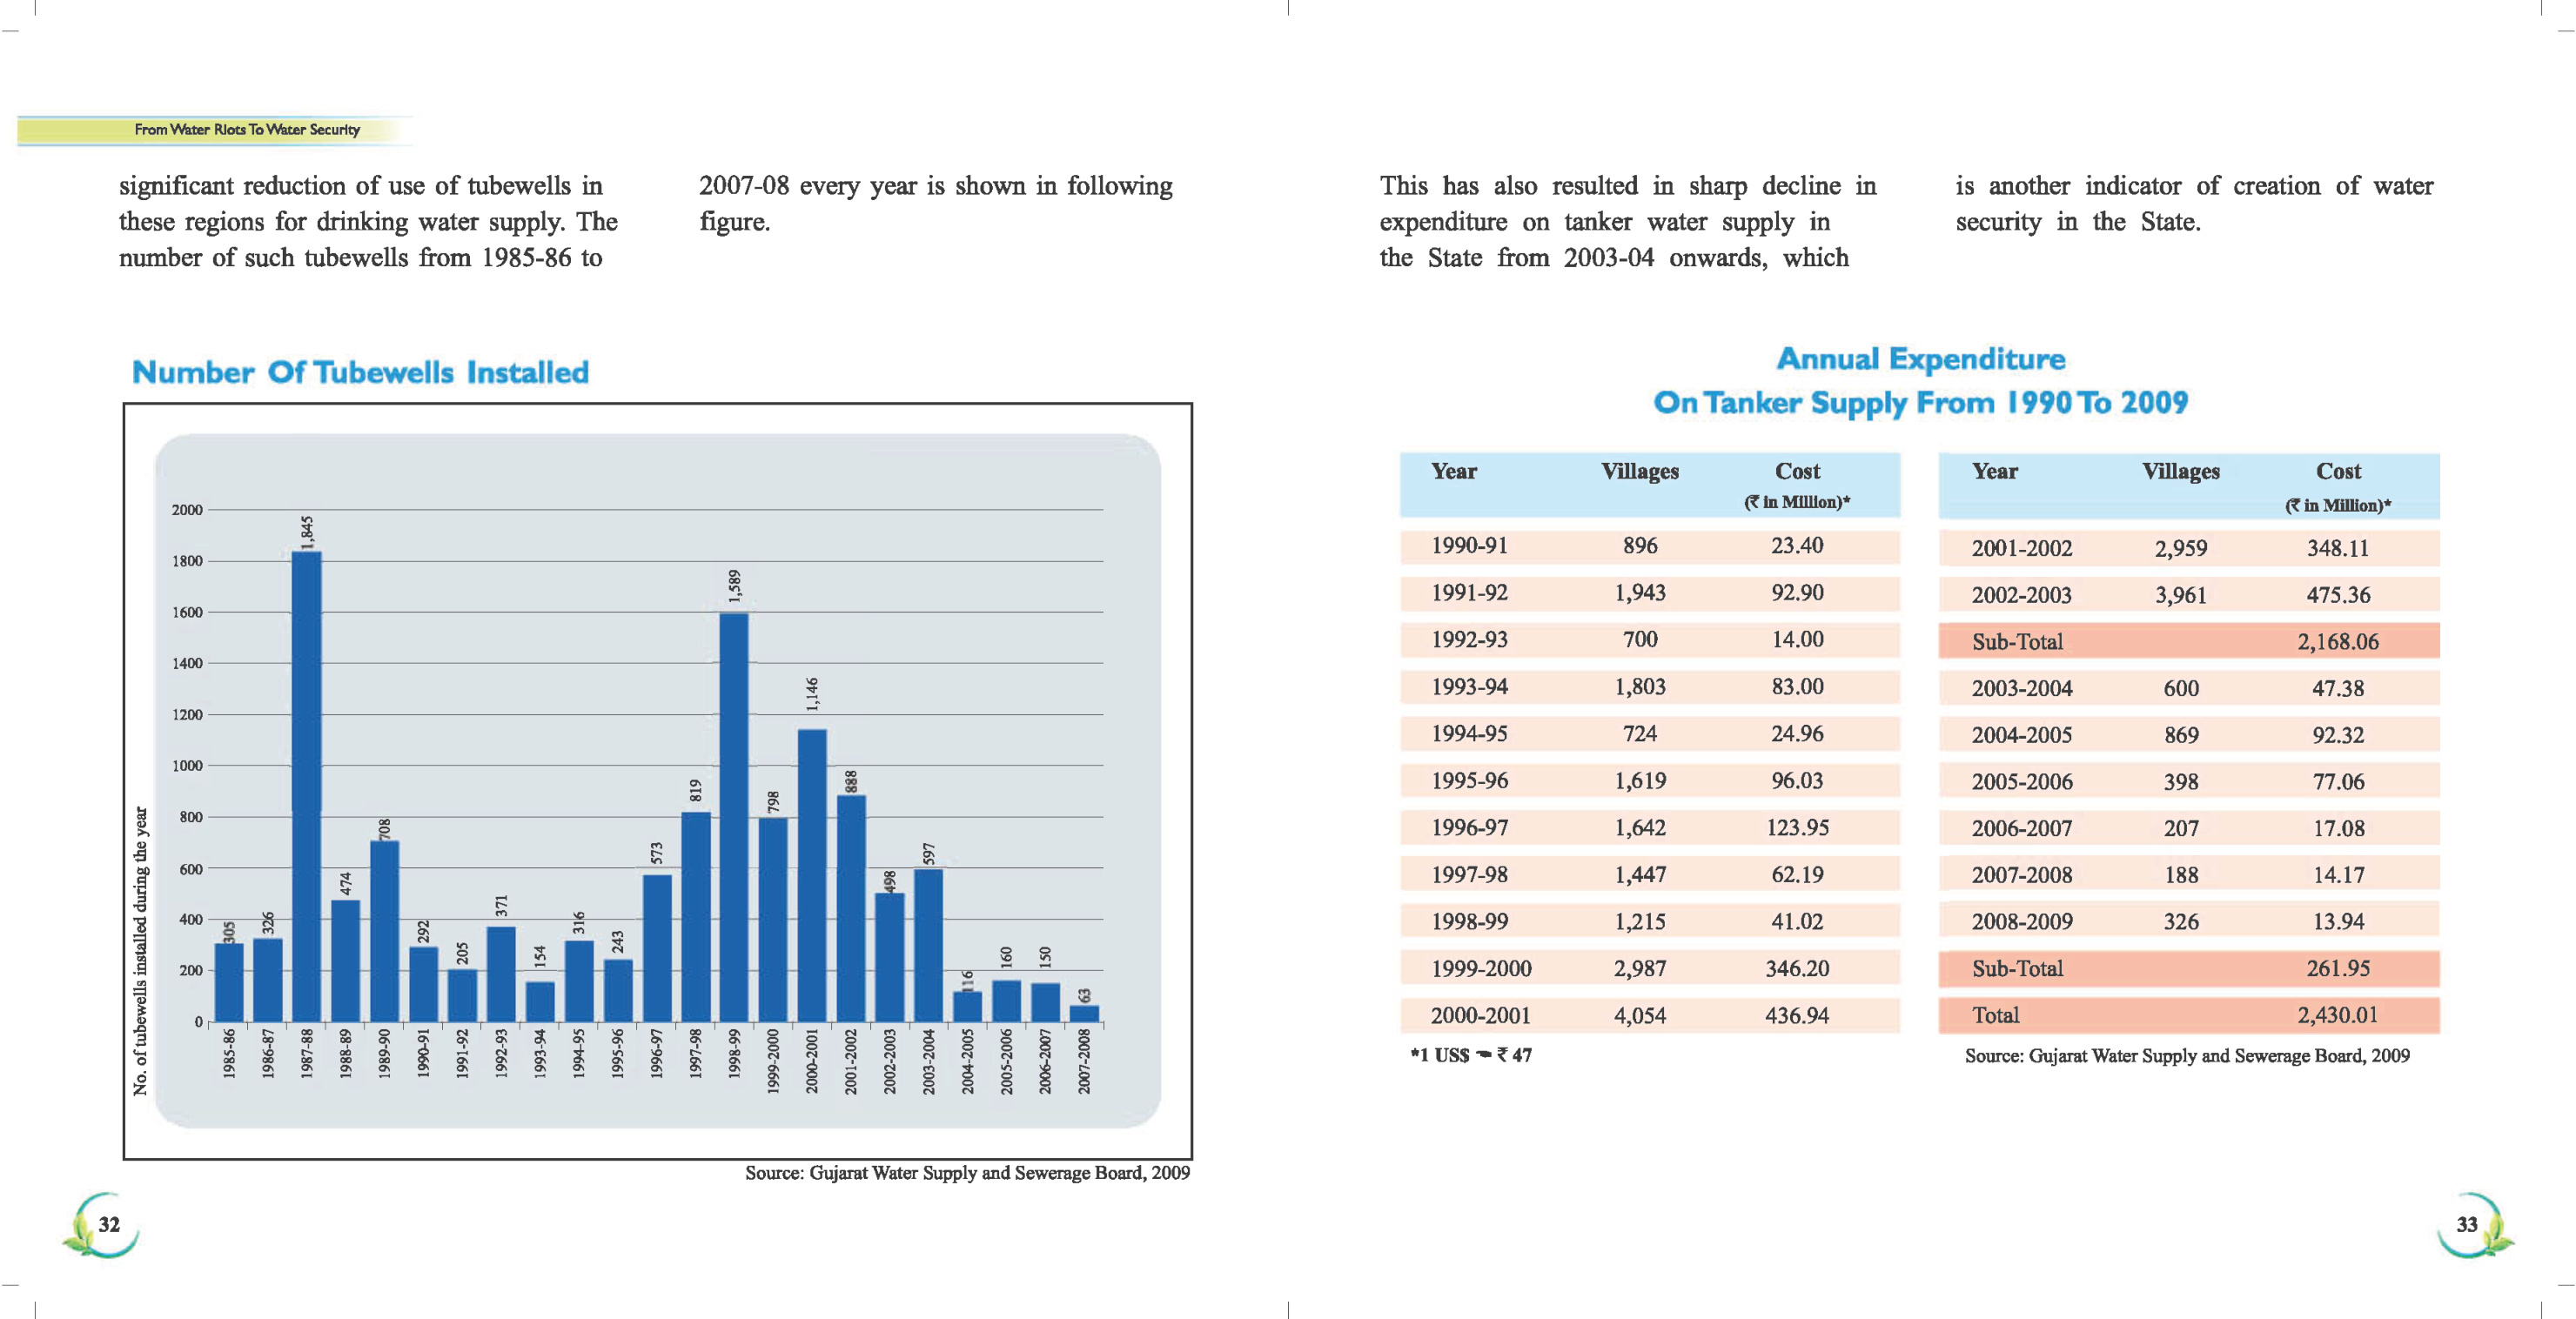
significant reduction of use of tubewells in 2007-08 every year is shown in following This has also resulted in sharp decline in is another indicator of creation of water
these regions for drinking water supply. The figure. expenditure on tanker water supply in security in the State.
number of such tubewells from 1985-86 to the State from 2003-04 onwards, which
Number Of Tubewells Installed Areusl Expenditure
On Tanker Supply From 1990 To 2009
Year Villages Cost Year Villages Cost
22000 ee in Million)* in Million)*
z
aa = 1990-91 896 23.40 2001-2002 2,959 348.11
1600 a 1991-92 1,943 92.90 2002-2003 3,961 475.36
1400
| 5 1993-94 1,803 83.00 2003-2004 600 47.38
1200 =
| 1994-95 724 24.96 2004-2005 869 92.32
ibe 3 [| zg 1995-96 1,619 96.03 2005-2006 398 77.06
i oe | | | 1996-97 1,642 123.95 2006-2007 207 17.08
5 a
F S00 |e ae | | | i EA 1997-98 1,447 62.19 2007-2008 188 14.17
z 400 5 | | i = | | | | | | | 1998-99 e215; 41.02 2008-2009 326 13.94
| g
F al tI | | | : | | I | / I | | | i : 2000-2001 4,054 436.94 Tol 0
é Pa 3 § Fe 3 3 2 8 R F : 2 e : 2 j 5 5 3 g 5 8 a *1 US$ = 747 Source: Gujarat Water Supply and Sewerage Board, 2009
g FRRER RRR eeeeRP EGR EEE ER
Source: Gujarat Water Supply and Sewerage Board, 2009
if 32 33 )
| | |