Original English text
| | |
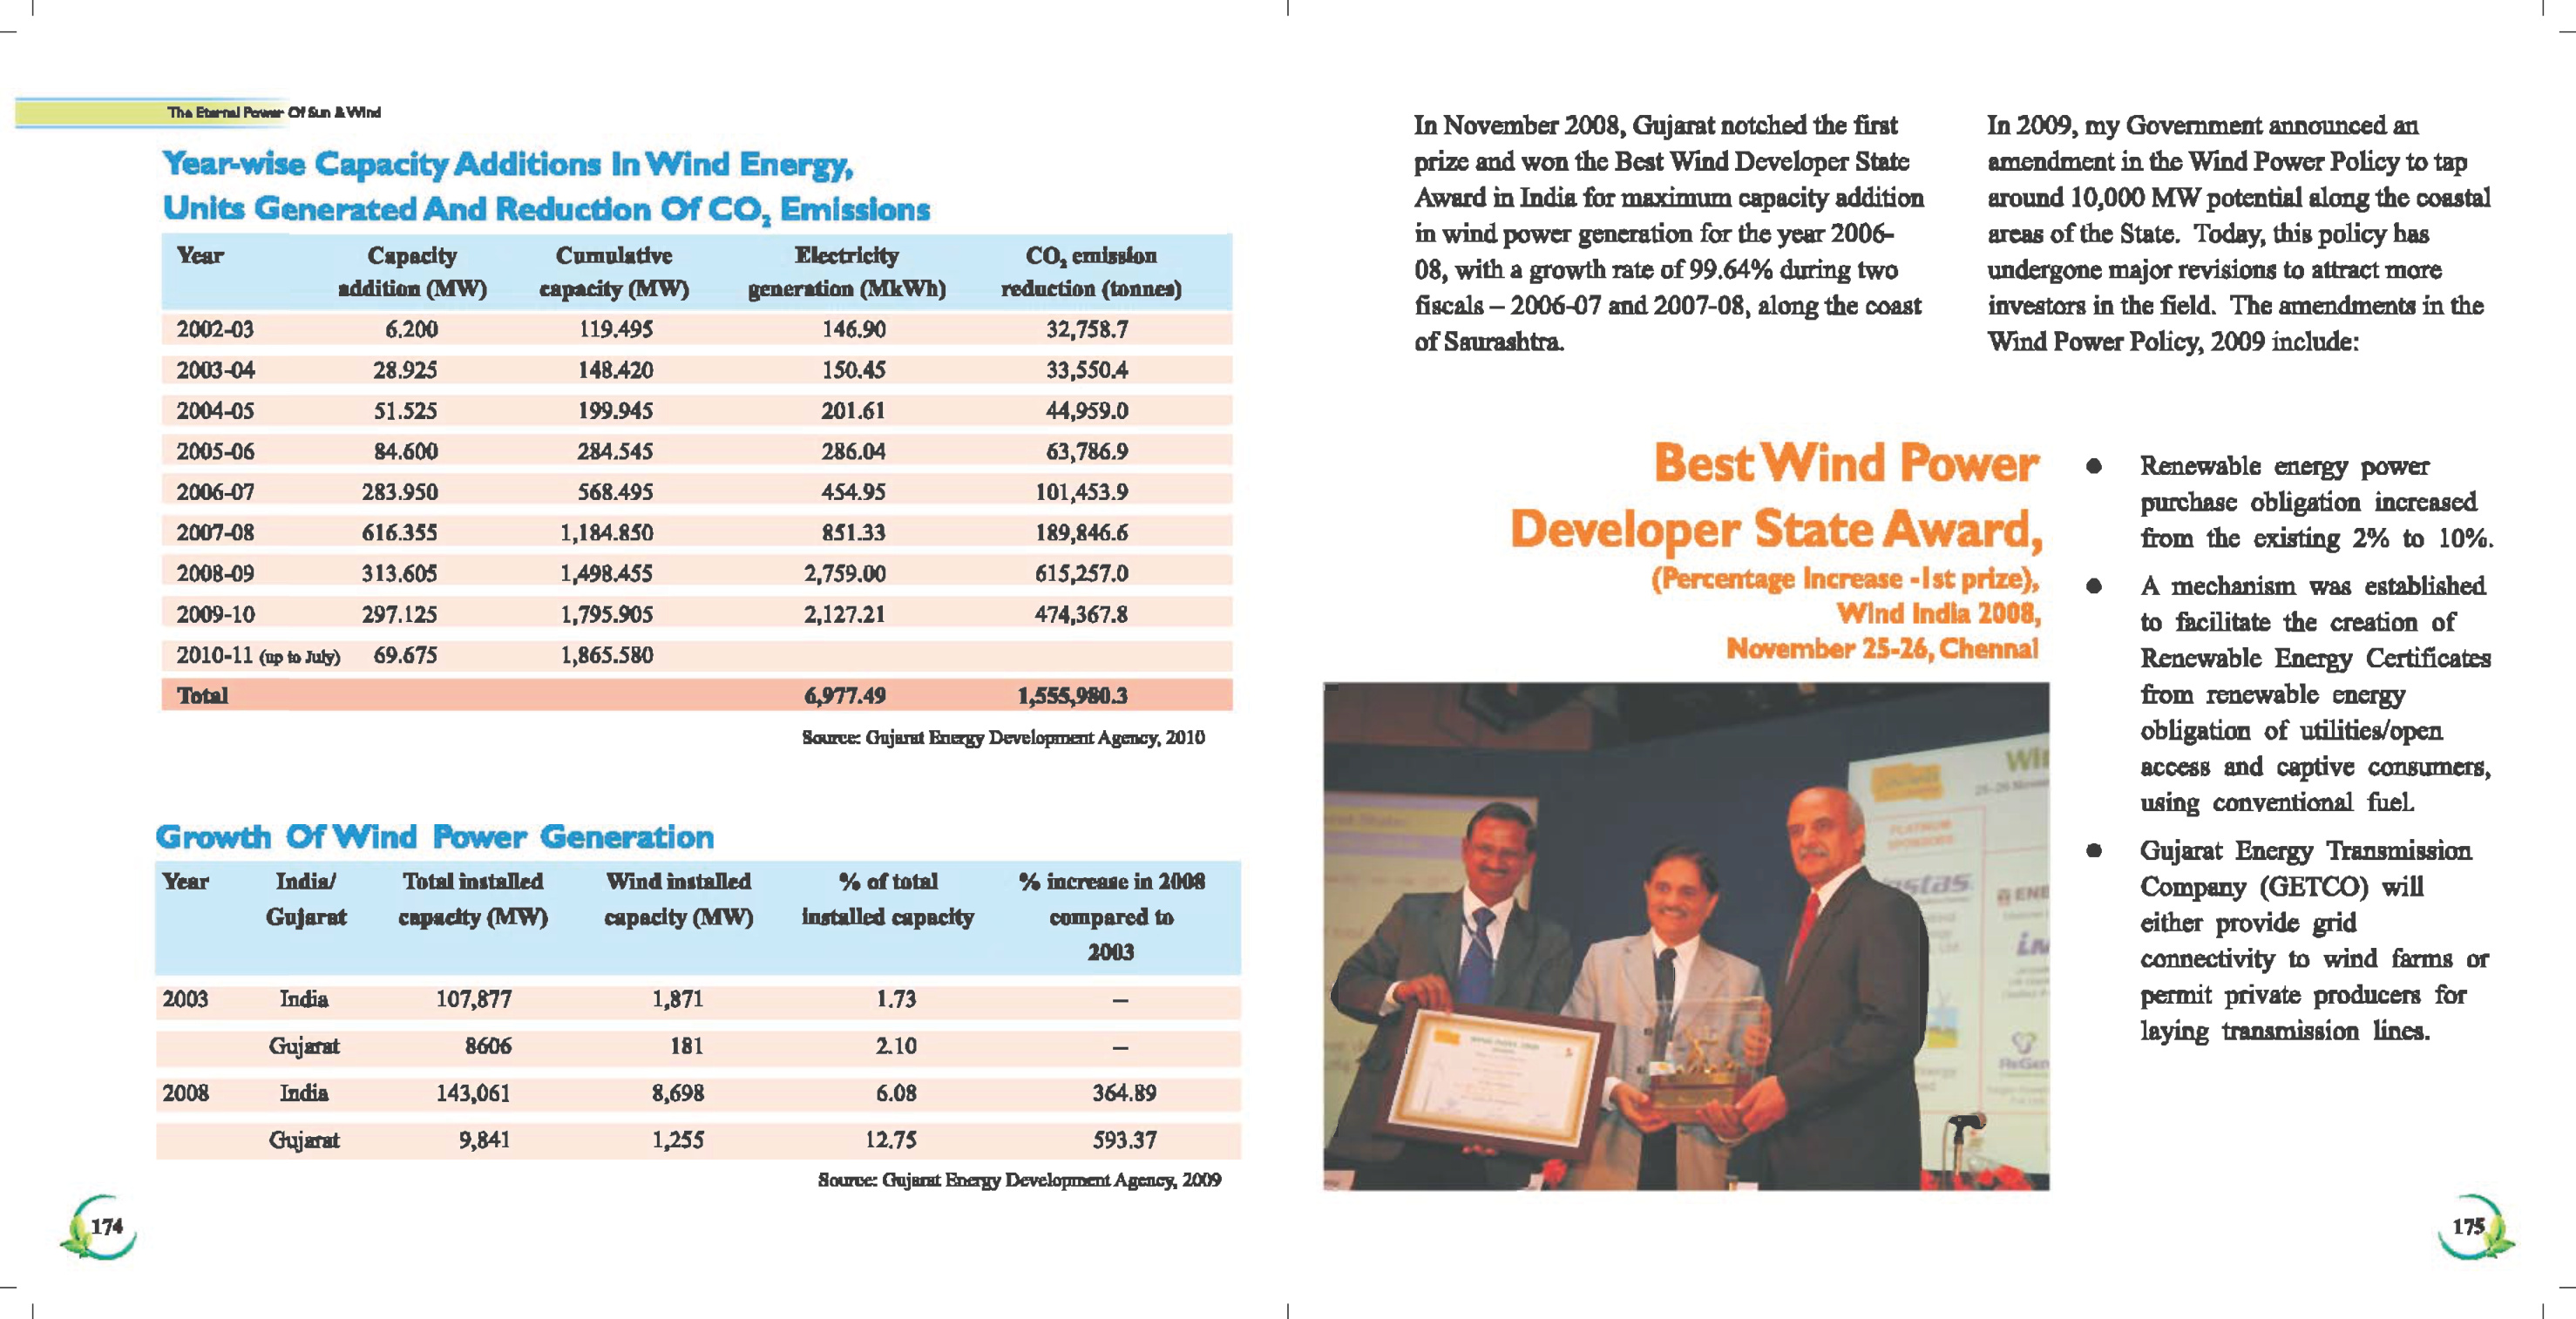
Seer ran avant In November 2008, Gujarat notched the first In 2009, my Government announced an
Year-wise Capacity Additions In Wind Energy, prize and won the Best Wind Developer State amendment in the Wind Power Policy to tap
Units Generated And Reduction Of CO, Emissions Award in India for maximum capacity addition around 10,000 MW potential along the coastal
= = oe 7 5 in wind power generation for the year 2006- areas of the State. Today, this policy has
sd Petal Saas cai ED ina aaa 08, with a growth rate of 99.64% during two undergone major revisions to attract more
om pacity (IW) E fiscals — 2006-07 and 2007-08, along the coast investors in the field. The amendments in the
2002-03 6.200 119.495 146.90 32,758.7 of Saurashtra. Wind Power Policy, 2009 include:
2003-04 28.925 148.420 150.45 33,5504
2004-05 51,525 199.945 201.61 44,959.0
2005-06 84,600 284.545 286.04 63,786.9 Wi Pov Ni R
2006-07 283,950 568.495 454.95 101,453.9 Best ind er ° aa
. : . ona purchase obligation increased
2007-08 616.355 1,184.850 851.33 189,846.6 Developer State Award, from the existing 2% to 10%.
2008-09 313.605 1,498,455 2,759.00 615,257.0 (Percentage Increase -Ist prize), e A mechanism was established
2009-10 297.125 1,795.905 2,127.21 474,367.8 Wind India 2008, to facilitate the creation of
2010-11 (op to uly) 69.675 1,865.580 November 25-26, Chennal Renewable Energy Certificates
77 7: ns Fc 0 from renewable energy
Source: Gujarut Energy Development Agency, 2010 , obligation of utilities/open
ae wit access and captive consumers,
ns using conventional fuel.
nae
Growth Of Wind Power Generation Sno © Gujarat Energy Transmission
Year India/ Total installed © Wind installed % of total % increase in 2008 ‘ gStTS ans Company (GETCO) will
Gujarat © cnpacity(MW) = capacity(MW) _installed capacity compared to q ; either provide grid
2003 ) Wea » - connectivity to wind farms or
2003 India 107,877 1,871 123 = SS wu. bb «| permit private producers for
Gujarat 8606 181 2.10 = ¥ 4 leying transmission lincs.
a>; =
2008 India 143,061 8,698 6.08 364.89 r
Gujarat 9,841 1,255 12.75 593.37 -) {
Source: Gujarat Energy Development Agency, 2009 ; ;
f 174 75)
| | |