Original English text
| | |
Big InAlso Beautiful (Sercar Sarovar Project)
over the last couple of years. In addition to in the reservoir). We operationalised this Environment - Sardar Sarovar Project
minor rivers, around 700 village tanks heve power house in August, 2004, and thereafter a © Catchment Area Treatment in 27,204 ha in forest Socattores taadeductiontanidea adedioreeta OY
also been filled-up with Narmada water as tiver bed power house of 1,200 MW capacity area and another 1,953 ha in non-forest area. 26.57% as compared to the year 1986.
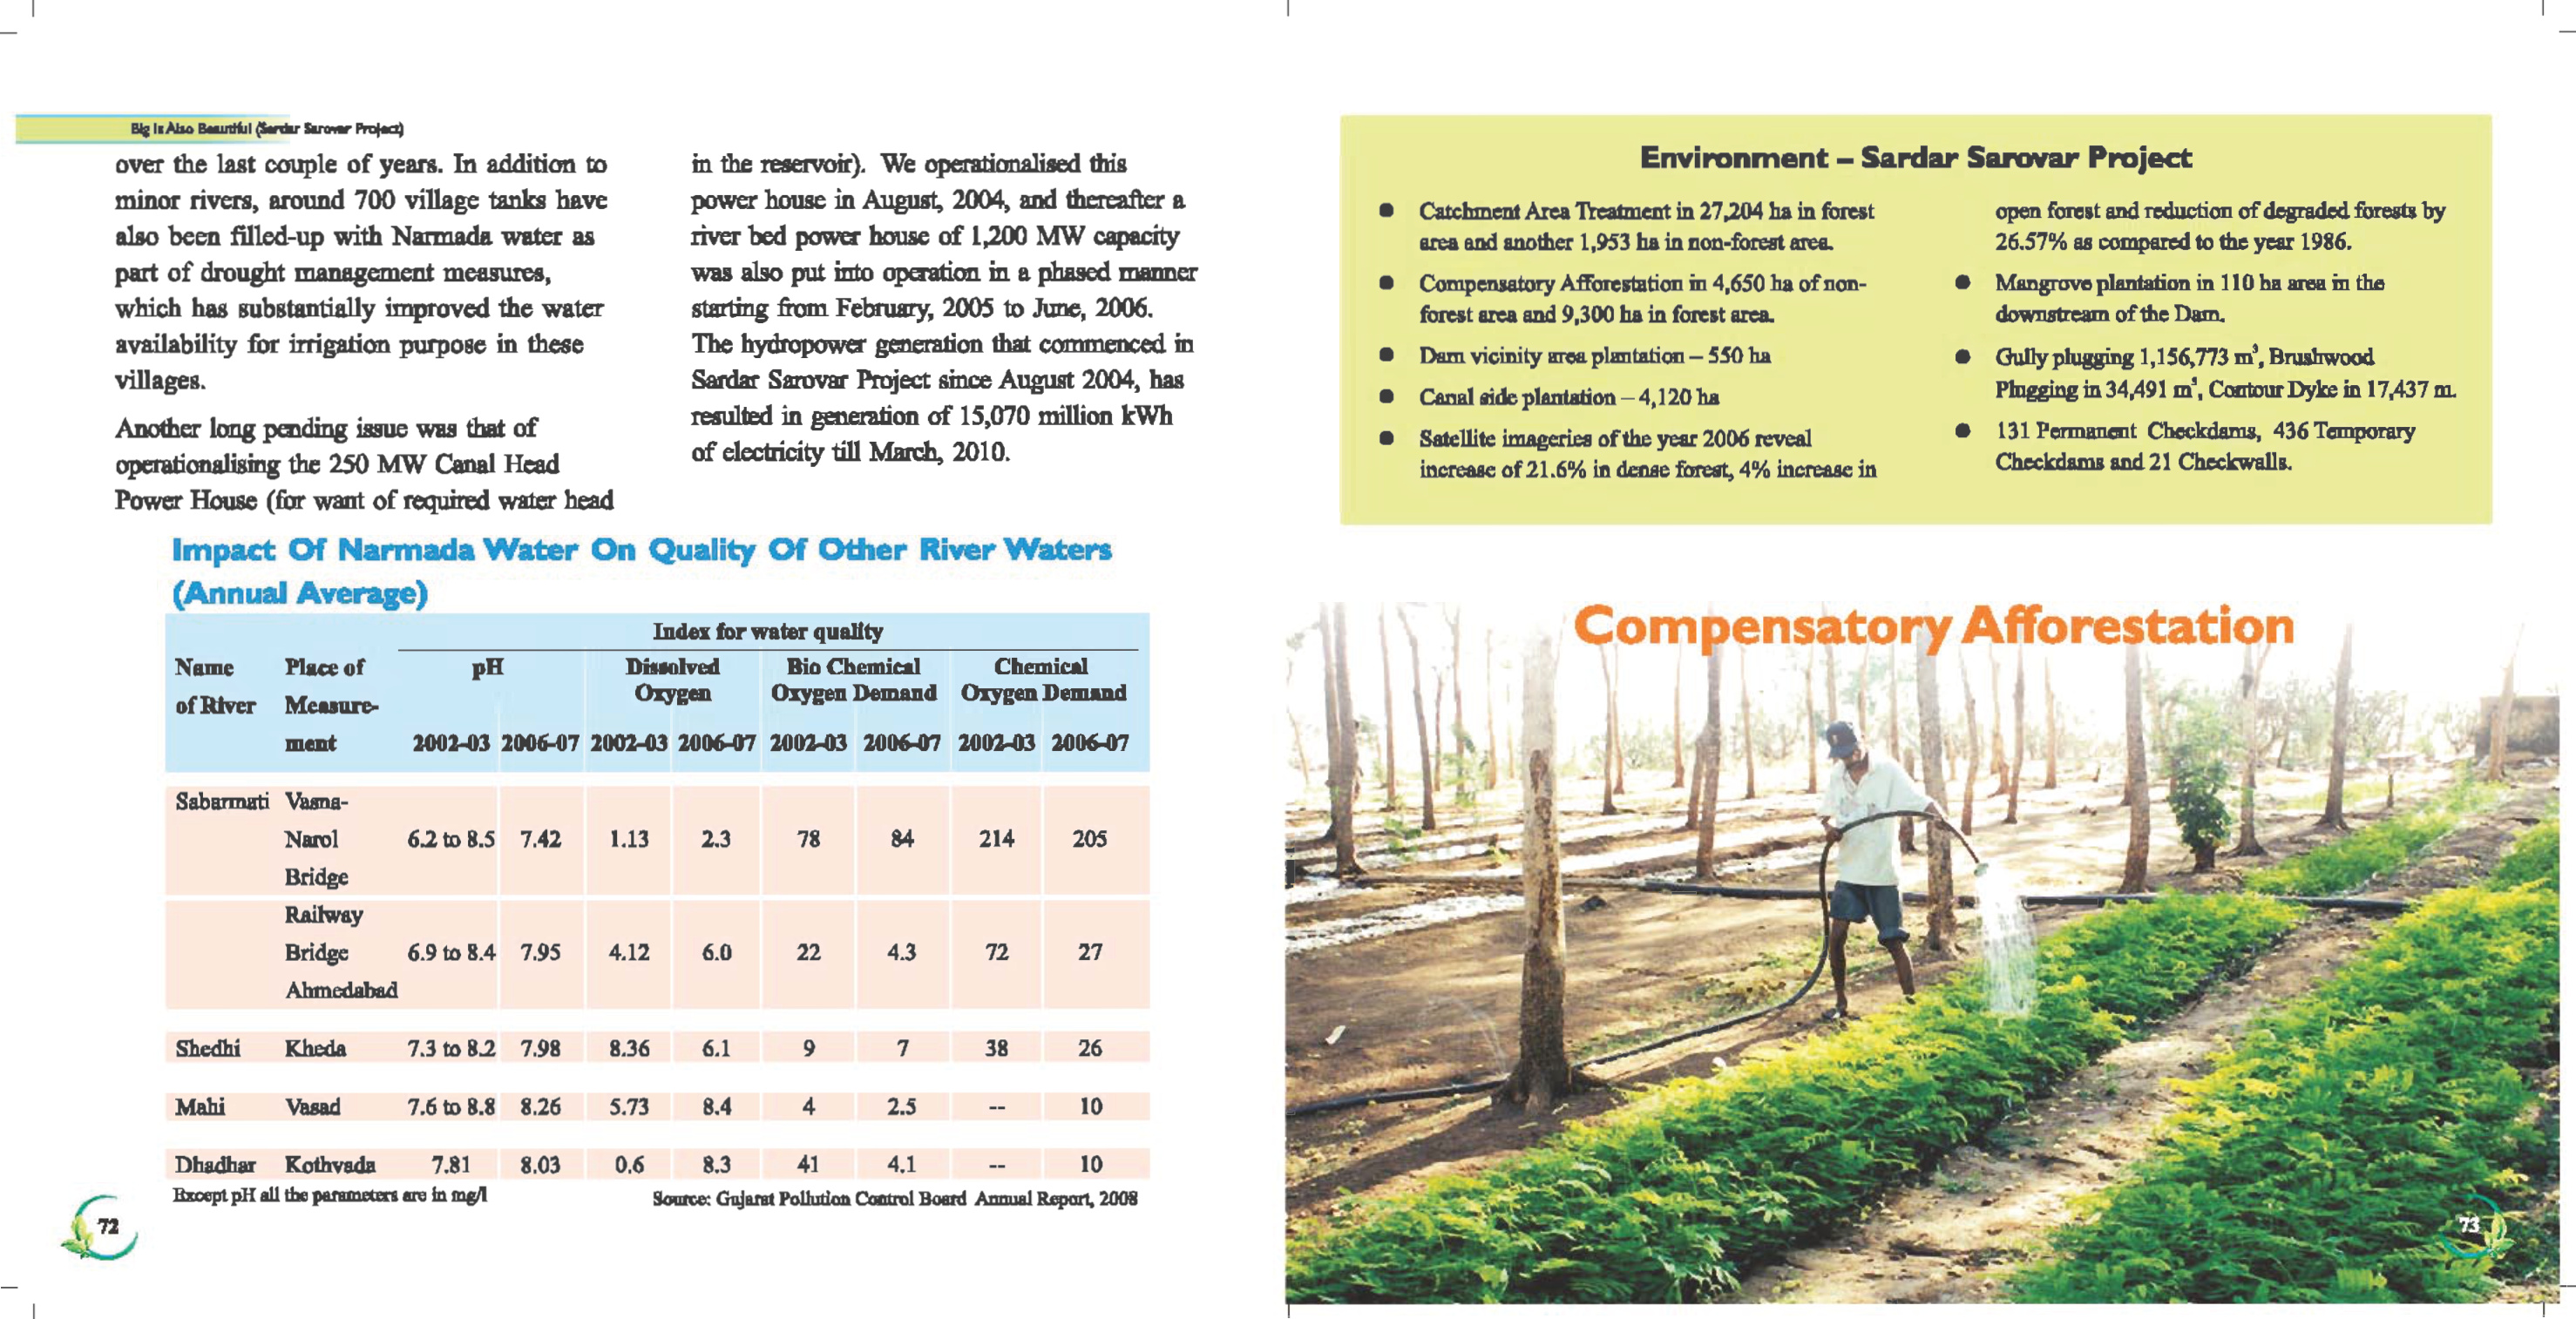
Ue, ba Cee Gaacten Teciatthoem ieee © Compensatory Afforestation in 4,650 ha of non- © Mangrove plantation in 110 ha area in the
whi substantially improved the water starting February, to June, 2006. forest area and 9,300 ha in forest area. downstream of the Dam.
availability for irrigation purpose in these The hydropower generation that commenced in ®@ Dem vicinity area plantation — 550 ha © Gully plugging 1,156,773 m’, Brustwood
villages. Sender Sarovar Project since Angust 2004, hae 0 Gtiishermmecipan Pingging in 34,491 m', Contour Dyke in 17,437 m.
es resulted in generation of 15,070 million kWh > f
Another long pending issue was that of of icity tll amen © Satellite imageries of the year 2006 reveal @ 131 Permanent Chockdams, 436 Temporary
operationalising the 250 MW Canal Head ° . increase of 21.6% in denae forest, 4% increase in Checkdams and 21 Checkwalls.
Power House (for want of required water head
Impact Of Narmada Water On Quality Of Other River Waters
(Annual Average) .
Inder for water qualty Compensatory Afforestation
Name Place of pH Dissolved Bio Chemical Chemical F
of Rt M Oxygen Oxygen Demand Oxygen Demand 7 +/} { { . ig ? im
ment 2002-03 2006-07 2002-03 2006-07 2002-03 2006-07 2002-03 2006-07 i 1h i\ i Be XR (em hE Aer ff, i. jul
— BED ele! eh Bee - sme ee
Nal 6285 742 113 23 78 & 214 205 o- ——-s a ee NX = “3 ae see
S 3 5 a ~ * —— — eine
Railway eee Pe 1 adh a. Toa Big ate e er
Bridge 69084 795 412 60 2 43 2 2 pe: ge = aa se Nee. oot
Ahmedabad " —— a a ae ae es a az a > i
ae as sig oe — Pit 3
Shedhi Kheda 7.3082 798 836 61 9 7 Sen ae gt Sa Bee i
aS * , =, SN oS ae ee ee
Mahi Vasad «= 7.6t0B8 826 5.73 84 4 25 = 10 ——— ass aes z See ae SR
A 8 8. \. < z ie Bo il : \" ia : se * Rs #
Dhadhar Kothvads 781 803 06 83 41 41 - 10 al ~ tn a ee ae a we
7 Basopt pall the parameters are in mg/l Source: Gujarat Pollution Control Board Annual Repart, 2008 aula ee a ee eS : se
- Sey So SS ; ree ae
| : : : ——— —r"